
What Is a Security Context Graph?
Editor's note: what this article calls the Security Context Graph is now called the Security Data Fabric. The name changed; the technology did not.
By David Mundy, VP of Marketing, Tuskira
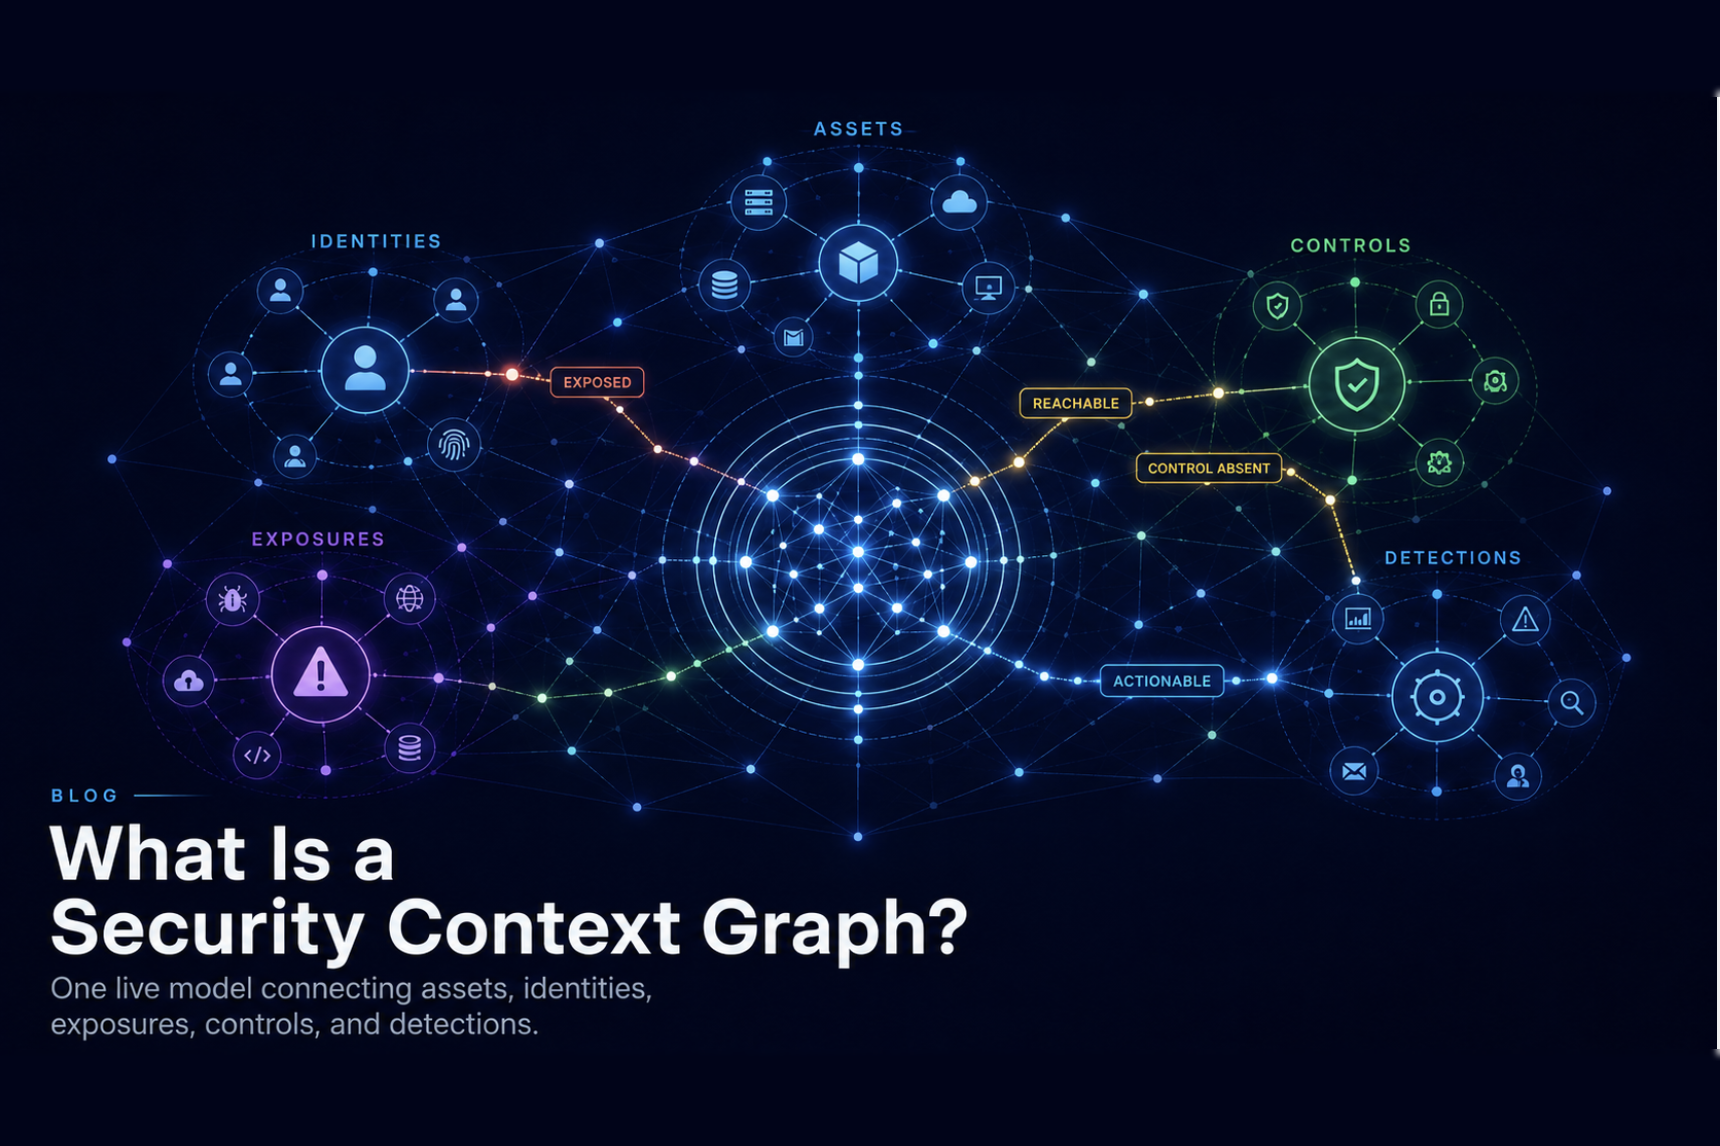
A security data fabric is a live, connected model of everything that determines risk in your environment: assets, identities, vulnerabilities, exposures, security controls, detections, and the relationships between them. It answers the question your tools can't answer individually: what can actually reach what, and is anything standing in the way?
Key takeaways
- A security data fabric connects assets, identities, exposures, controls, and detections into one live model.
- Unlike a SIEM, it models relationships and current state rather than primarily storing events.
- Unlike an attack graph, it includes defensive controls and detection coverage.
- It provides the shared context AI agents need to reason about reachability, blast radius, and response.
Security teams don't suffer from too little context. Every tool in the stack produces context: scanner findings, identity posture, cloud misconfigurations, endpoint telemetry. The problem is that it arrives as fragments, each in its own schema, each scoring risk on its own scale, none aware of the others. Most platforms respond by creating more context. What teams need is one context.
What does a security data fabric contain?
Five layers, connected:
- Assets and applications (servers, cloud workloads, domains, business apps): what exists, and what matters?
- Identities (users, service accounts, privileges, trust paths): who can act, and with what power?
- Exposures (vulnerabilities, misconfigurations, weak auth): where are the openings?
- Controls (firewall rules, EDR policies, WAF, identity enforcement): what's defending each opening?
- Detections and behavior (alerts, telemetry, exploit activity, threat intel): what's happening right now?
The graph part matters more than the list. A critical CVE is a row in a table. Connected context turns that row into a decision, and the graph is what makes the connection. It's also live: updating continuously as the environment changes, functioning as a digital twin of the security estate rather than a point-in-time snapshot. A model of last Tuesday's environment answers last Tuesday's questions.
A worked example: from CVSS 9.8 to a decision
A scanner reports CVE-X as critical. On its own, that's a severity score. The context graph connects it, step by step:
- 1. Asset. The finding maps to a production workload, not a dev box, and that workload backs a revenue application.
- 2. Exposure. The workload is internet-reachable, and the vulnerable code path is exercised in production.
- 3. Identity. The service account it runs under holds privileges that reach the customer database.
- 4. Controls. The WAF rule that would block this exploit pattern is not deployed on that route, and the EDR policy doesn't cover the technique.
- 5. Verdict. Instead of "CVSS 9.8," the answer is: reachable, critical asset downstream, effective control absent, act now, and here's the control change that closes the path while the patch is tested.
Same finding, entirely different output: not a score, a decision with evidence.
Why isn't a SIEM a security data fabric?
A SIEM is built to ingest, index, and analyze events; a context graph is built to persist relationships and current security state.
Events tell you what happened: a login, a process launch, an alert. State tells you what is: which identities hold which privileges, which vulnerabilities sit on which reachable paths, which controls cover which exposures. Skilled teams can layer enrichment, lookups, and correlation logic on top of SIEM data, but a question like "show me every path from the internet to our payment database that no control currently blocks" is a graph query over modeled state, not a log search, and answering it reliably means maintaining exactly the entity and relationship model the SIEM was never designed to hold.
There's a cost dimension too. Centralizing all telemetry to make it searchable is exactly the economic model that has SIEM bills growing faster than security budgets. A context graph doesn't need every log; it needs the relationships and current state, with raw telemetry pulled only when an investigation demands it.
Why isn't a data lake context?
A data lake solves storage, not meaning. Landing scanner output, CSPM findings, and identity data in one bucket puts fragments in one place; it doesn't connect them. Schemas still disagree, entities still don't resolve to each other (is web-prod-04, 10.2.1.17, and i-0abc123 one asset or three?), and no relationship exists until someone builds it. A context graph is what you get after the hard work a data lake defers: normalization, deduplication, entity resolution, and relationship mapping, done continuously rather than per-query.
Why do security telemetry programs fail?
Many security-data programs attempt to solve this through telemetry unification, and they stall for three predictable reasons:
- Normalization debt. Every source speaks its own schema, and mapping them by hand is an engineering project that never ends. The moment a tool updates its format, the mapping breaks silently.
- Entity resolution. Correlating data is worthless until the platform knows that three identifiers across three tools are the same machine, and that a service account belongs to a business application. Skipping this step is why so many "single pane of glass" projects produce panes of glass nobody trusts.
- Staleness. Batch pipelines produce yesterday's environment. Attack paths open and close in hours; a weekly-refreshed model can't defend anything.
Operationalizing telemetry into context means inverting the model: connect to tools through native integrations and query them in place rather than piping everything into one store, resolve entities automatically, model the relationships, and keep the graph continuously current. Storage was never the hard part. Meaning is.
Security data fabric vs. attack graph
An attack graph models one thing well: the paths an attacker could take through your environment. It's a genuinely useful structure, and it's a subset of a security data fabric, not a competitor to it.
What the attack graph typically leaves out is the defense. Knowing a path exists is half the question. The other half: is the path's entry vulnerability actually exploitable as deployed, would your existing controls block the exploit pattern, and would you detect the attempt? A context graph carries control state and detection coverage alongside the attack surface, which is what turns "here's a scary path" into "here's the one control change that severs it." Attack graphs find paths. Context graphs decide what to do about them.
("Security knowledge graph" is the academic umbrella term for graph-structured security data. A security data fabric is the operational version: live, environment-specific, and built to be acted on.)
Why CTEM needs one
Continuous Threat Exposure Management stumbles in practice at one step: mobilization. Programs get good at discovering and scoping exposures, then hit a wall converting findings into decisions, because validation and prioritization require exactly the cross-tool context no single tool holds. Exposure data without control state produces patch lists. Exposure data joined to reachability, exploitability, and defense coverage produces decisions: patch now, compensate and monitor, or defer with evidence. The context graph is the layer that makes the second mode possible; it's why agentic CTEM can run continuously where manual programs restart every quarter.
Why agentic AI is the reason this matters now
AI agents are only as good as the context they reason over. Give a capable model fragmented, contradictory, unresolved data and it produces confident nonsense at scale. Give it a structured, current, connected model of the environment and it produces investigations with evidence: this alert is real, here's the blast radius, this CVE is unreachable, here's why.
That's why the security data fabric is the foundation of agentic security operations: detection, exposure management, investigation, and response all reasoning over one shared model instead of four fragmented views. Tuskira's Security Data Fabric is the shared reasoning layer behind its exposure, breach-path, investigation, and response agents: Kairo chains exposures and identities into breach paths, Lattice cuts millions of vulnerability findings to the exploitable few, Iris investigates alerts to verdicts, Quell answers zero-day reachability in minutes. The more sources connect to the graph, the sharper every agent gets, because they share one context instead of four. (Architecture: the Tuskira platform.)
Without a context graph, "AI for security operations" means a chatbot summarizing your fragmented tools. With one, it means agents that decide.
Evaluating platforms this year? Start with our buyer's guide to AI cyber defense platforms: five dimensions and fifteen questions to ask every vendor, including us.
Frequently asked questions
What is a security data fabric in one sentence?
A live, connected model of assets, identities, exposures, controls, and detections that lets security teams and AI agents evaluate any risk against the full state of the environment.
Is a security data fabric the same as an attack graph?
No. An attack graph models attacker paths; a security data fabric includes attack paths plus control state and detection coverage, so it can answer whether a path is exploitable and defended, not just whether it exists.
How is it different from a security mesh or data fabric?
Mesh and fabric architectures describe how data and services interconnect; they're plumbing patterns. A security data fabric is the model that plumbing should produce: resolved entities, mapped relationships, and current state that decisions can be made against. You can build the pipes and still have no context.
Do I need to centralize my data to build one?
No. Native integrations can query tools in place and maintain the graph as state, pulling raw telemetry only when an investigation requires it. Centralization is a cost model, not a requirement.
How is this different from a CMDB?
A CMDB inventories assets, usually stale and manually maintained. A context graph is continuously updated, includes exposures, controls, identities, and detections, and models the relationships between them.
Why do AI agents need a context graph?
Agent reasoning quality is bounded by input structure. A shared, current graph grounds every investigation in the same verified environment state, which is what makes autonomous verdicts trustworthy and auditable.
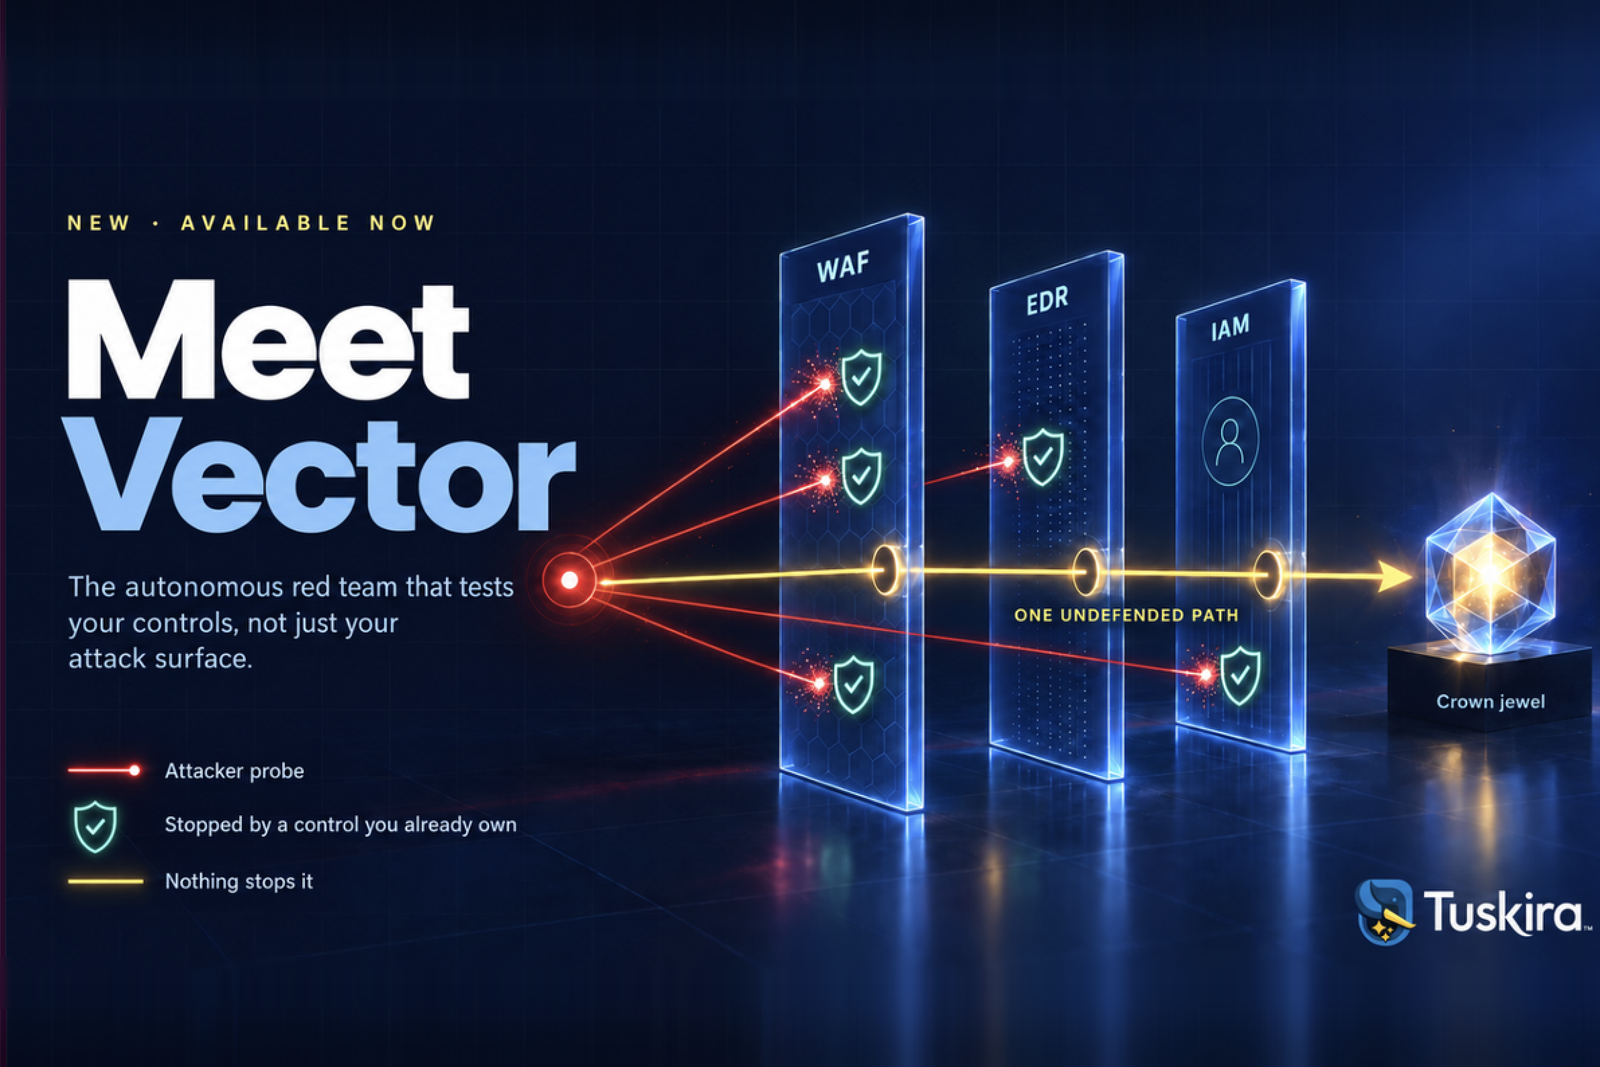
Meet Vector: Autonomous Red Teaming That Doesn't Stop at Exposed
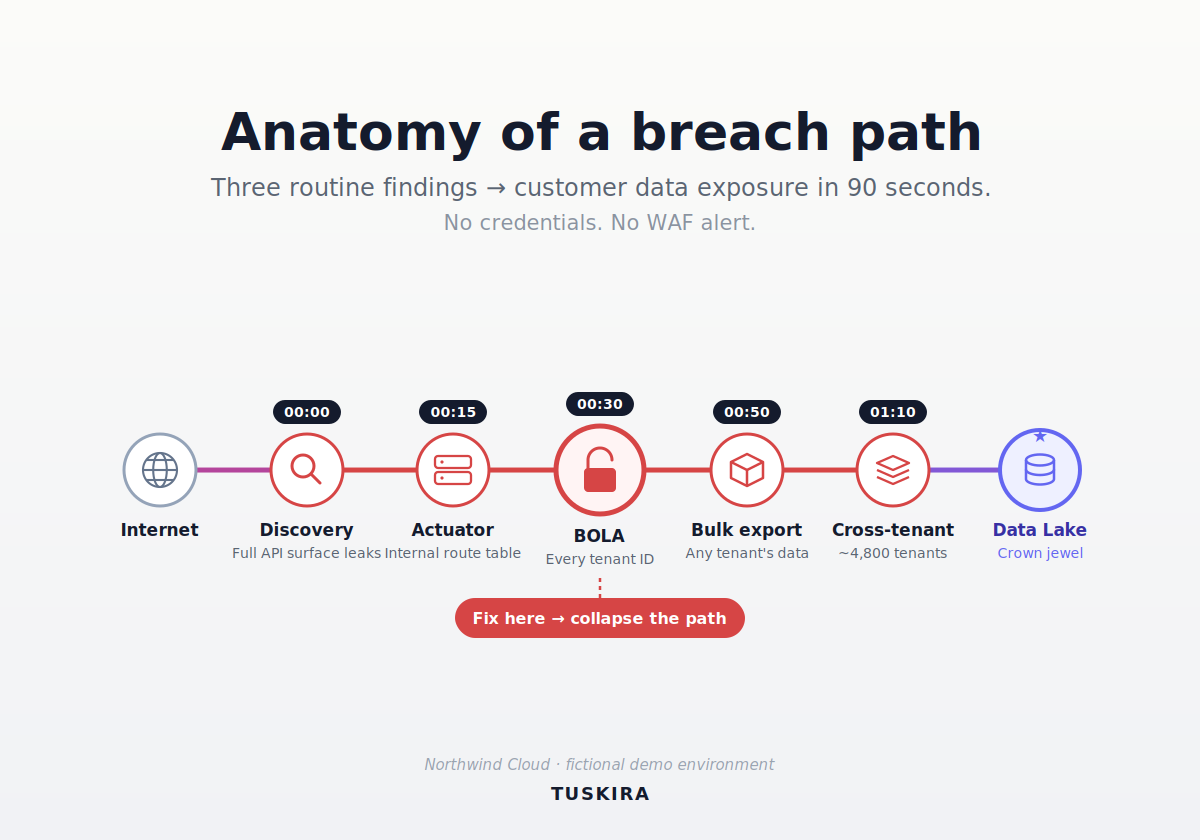
Anatomy of a Breach Path: How Three Boring Bugs Become a 90-Second Data Breach
